
Transforming a Marketing Agency into a Platform (No Dev Team Required)

This project was completed prior to the founding of JAMworks, during my time as UX/UI Designer and Marketing Manager at Incendium. The strategy, design, and execution were entirely my own.
Client: Incendium
Services: Dashboard Design, AI Prototyping, UX Strategy
Platform/Tools: Lazy AI, Google Cloud
Role: Marketing Manager, UX/UI and Web Designer
The Situation

John pictured, reacting to the dashboard being shelved
The original ask was a straightforward build for a dashboard that gave clients live visibility into their campaign performance. Prospect data, outreach status, engagement signals, in one place and accessible without the need for marketing associate or manager input. It was the kind of tool that makes an agency look like it has its act together.
The project died quietly without dev resources, or budget for infrastructure; something I took personally. No animosity toward anyone on the team, I felt responsible for the project not going forward.
Why This Matters for Agencies
Marketing agencies have always faced a version of the same problem: clients want transparency, and building the systems that provide it is expensive. For years, that meant the tool you actually needed lived behind a six-figure development contract.
AI-assisted development has changed that calculus. Tools that generate functional front-end code from natural language prompts have made it possible for designers and strategists to prototype working software without a dedicated engineering team. For agencies operating lean, that is not a small thing.
The numbers back it up. According to Salesforce's 2024 State of Marketing report, more than half of marketers have access to real-time campaign data, but the majority still need IT's help to act on it. The data exists. The access does not.
That gap is exactly what a well-built client dashboard closes. When clients can see their own data and act on it directly, the agency stops being the bottleneck.
The Problem
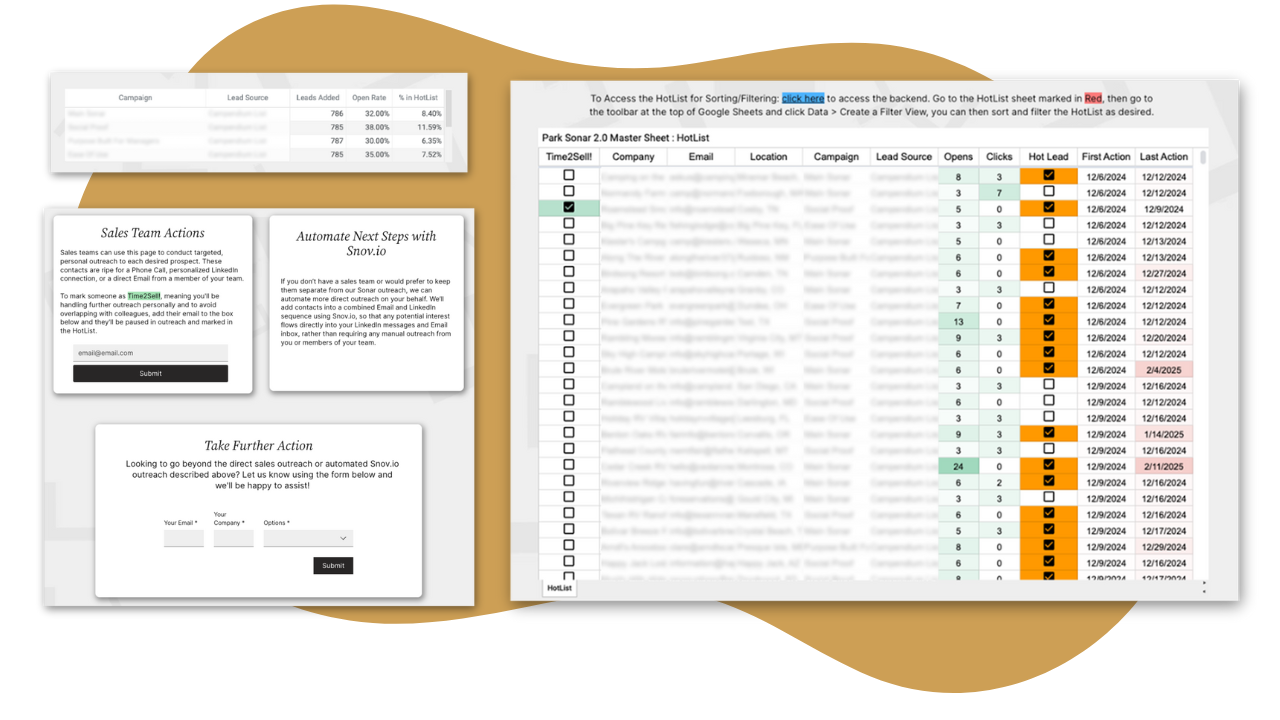
When the dashboard project was shelved, the gap it left was papered over with a Google Sheet embedded into a client portal. Clients could view it, but they could not interact with it, filter it, take action from it, or trust that it reflected anything current. It was a static snapshot dressed up as a live tool.
The underlying data was solid, and the outreach campaigns were performing. But clients had no way to see that in real time, and every question about campaign status became a manual update request routed through the team. Beyond the noise it created internally, it kept clients at arm's length from their own prospects. They could not act on a warm lead, adjust outreach, or make a single decision without going through the agency first. It created noise, slowed things down, and made the agency look less capable as a result.
I had recently led a complete website redesign, which made the dashboard gap harder to ignore. When the rest of the client experience had been rebuilt from the ground up, a static spreadsheet in an iframe undercut everything around it. An agency that hands clients a live tool with real controls starts to look less like a service provider and more like a platform, and that possibility was now sitting right in front of us.
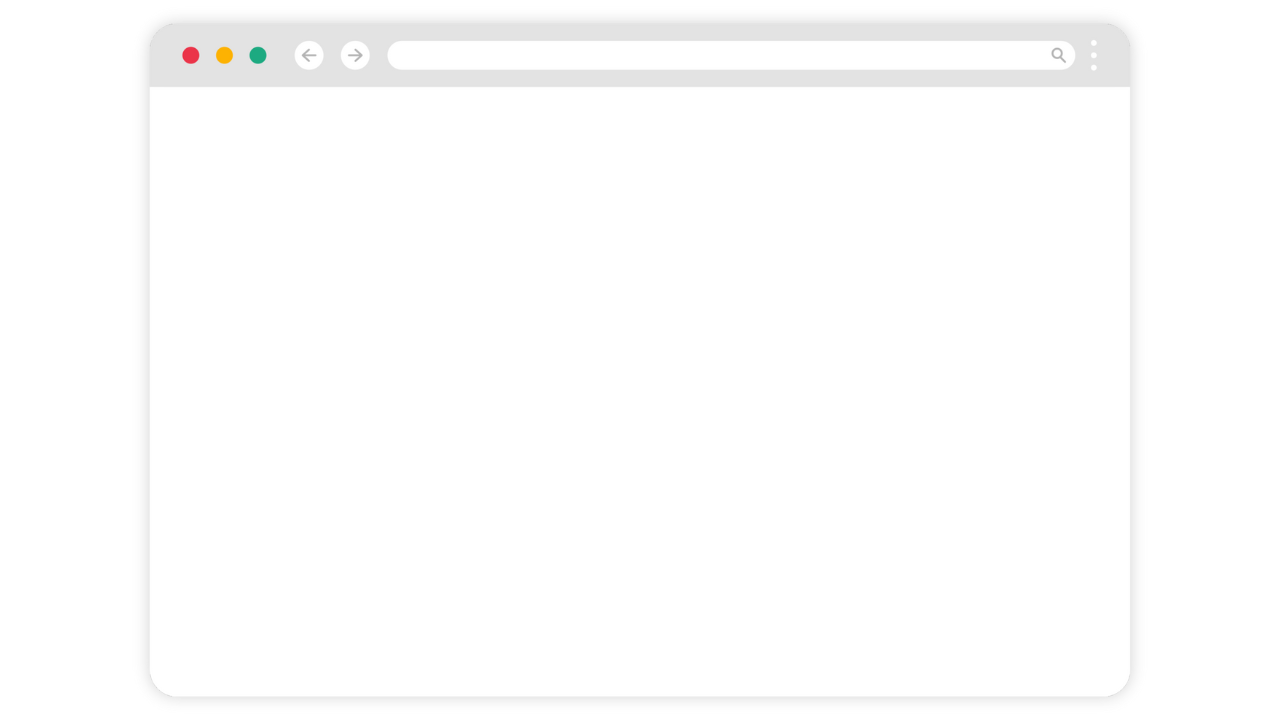
This was what clients saw. A spreadsheet in a frame is not a dashboard.
The Approach
Prototyping on the Side
The project came back into view when AI development tools started gaining traction. One tool in particular, Lazy AI, made it possible to describe a functional interface in plain language and get working code back. That changed the constraint entirely.
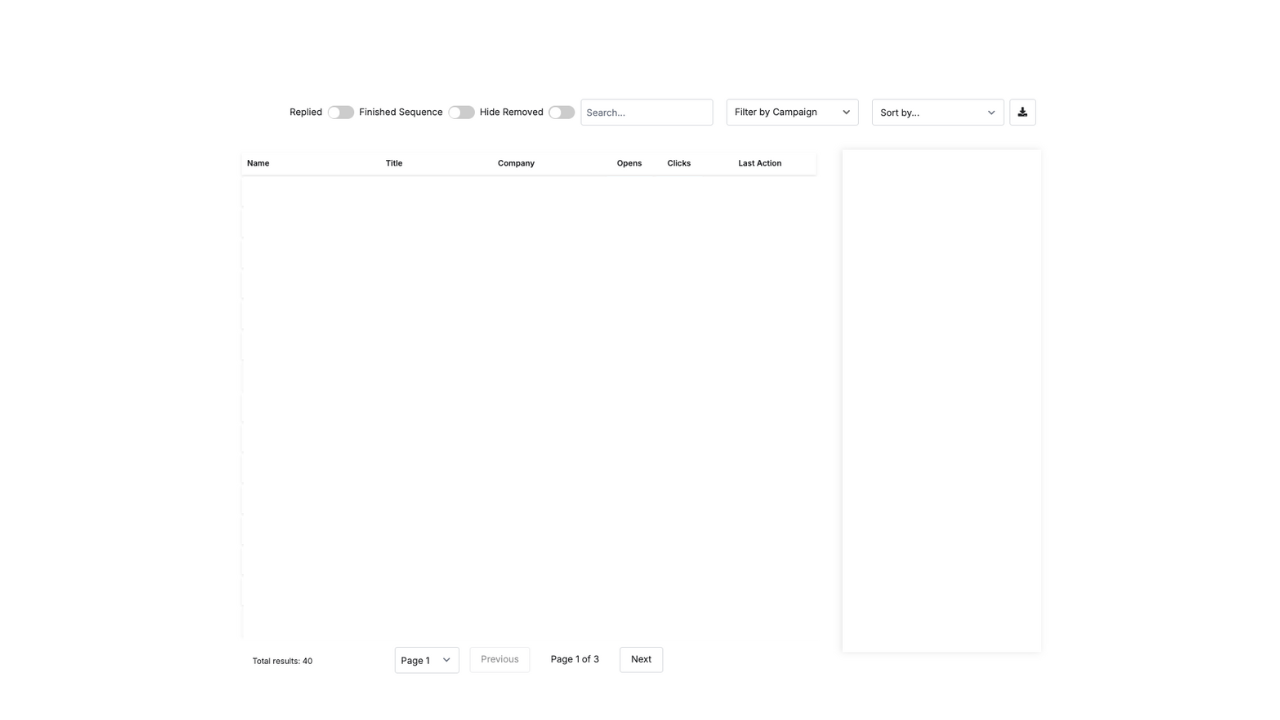
I built a functioning prototype in off hours over the course of a few days. It pulled live data, allowed clients to take direct action, and looked like it belonged inside the platform. The prototype was not polished. That was not the point. The point was to demonstrate that the capability existed and could be built without waiting for a dev team or a budget allocation.
Rough around the edges. Exactly right where it counted.
Getting Buy-In
The prototype went to the CFO first, with a pitch that made itself: the tool worked, it cost roughly $20 a month to run, and Google Cloud infrastructure overhead was low enough that scaling would not meaningfully change the cost structure. The founder saw it the same week. Budget was approved.
The argument made itself. When you can show a working product at negligible cost, the conversation shifts from "can we afford to build this" to "why haven't we already?"
Building the Real Thing
The production version was built around three requirements. It had to be fully automated, removing manual update work from the team entirely. It had to reflect live data, not cached snapshots. And it had to give clients the ability to act directly from the dashboard rather than routing every action through an associate.
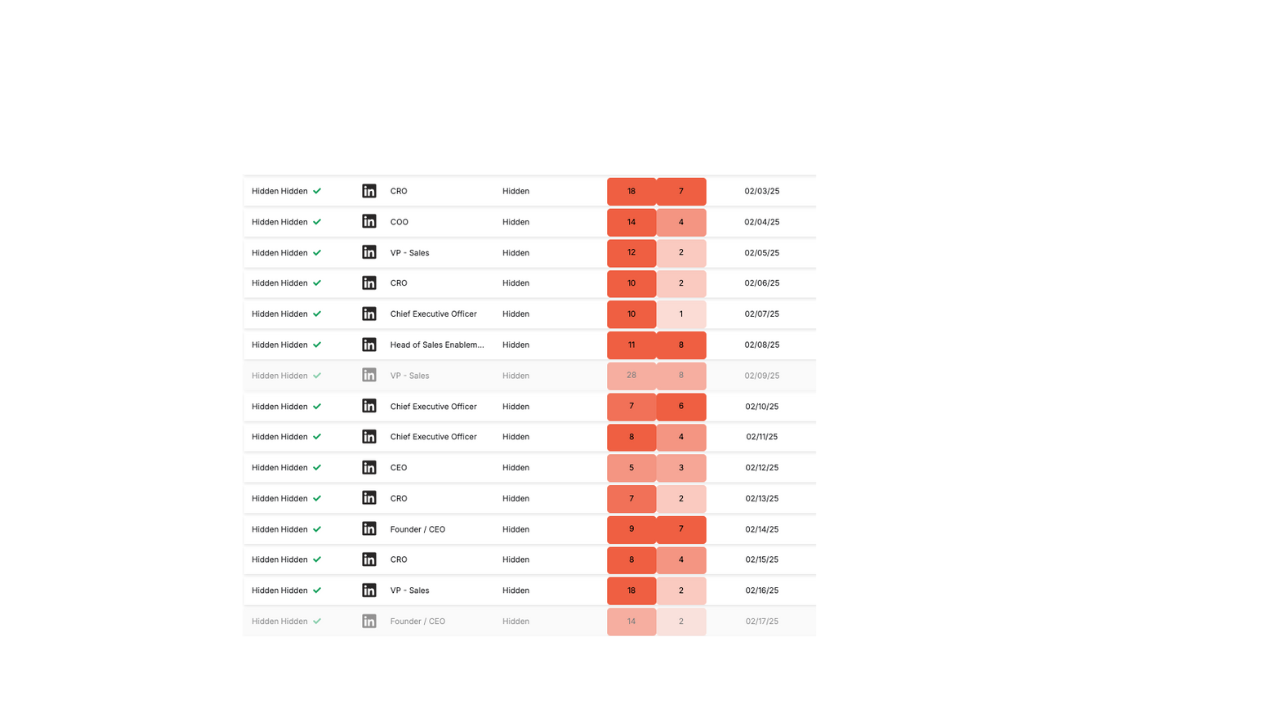
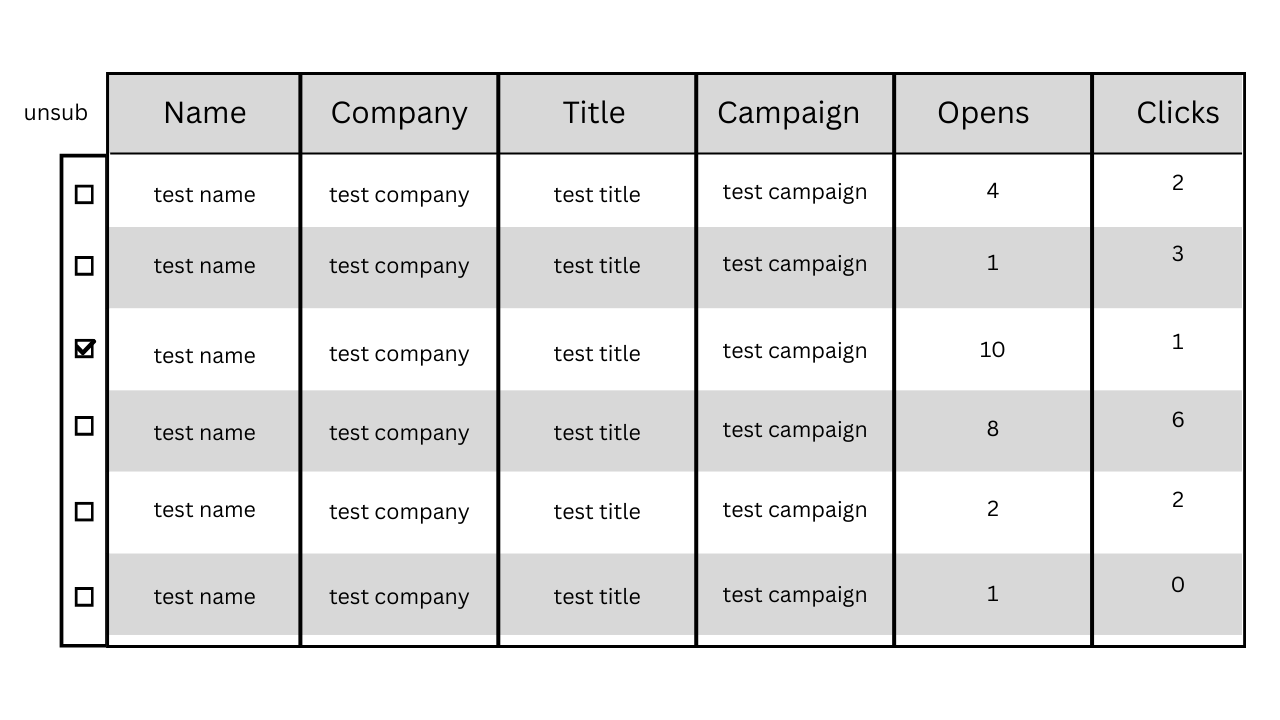
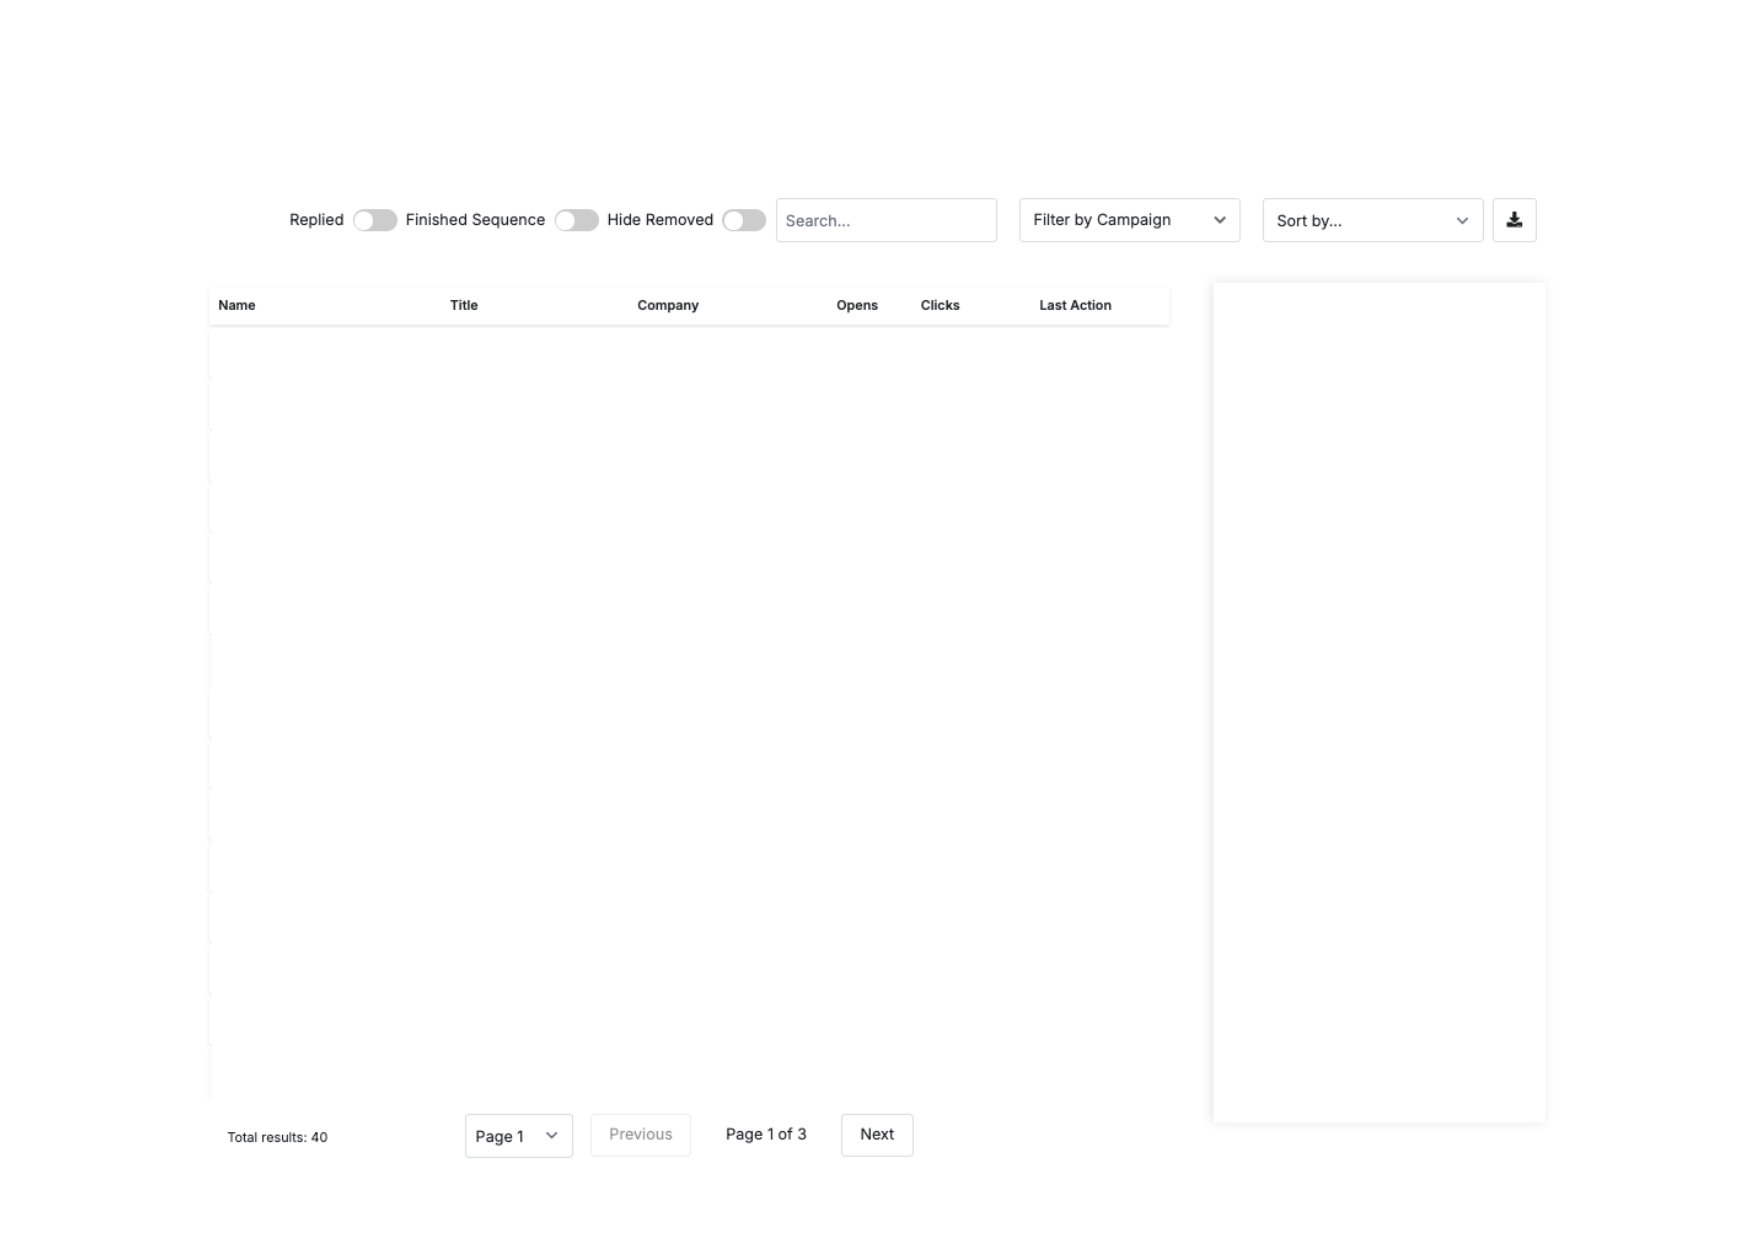
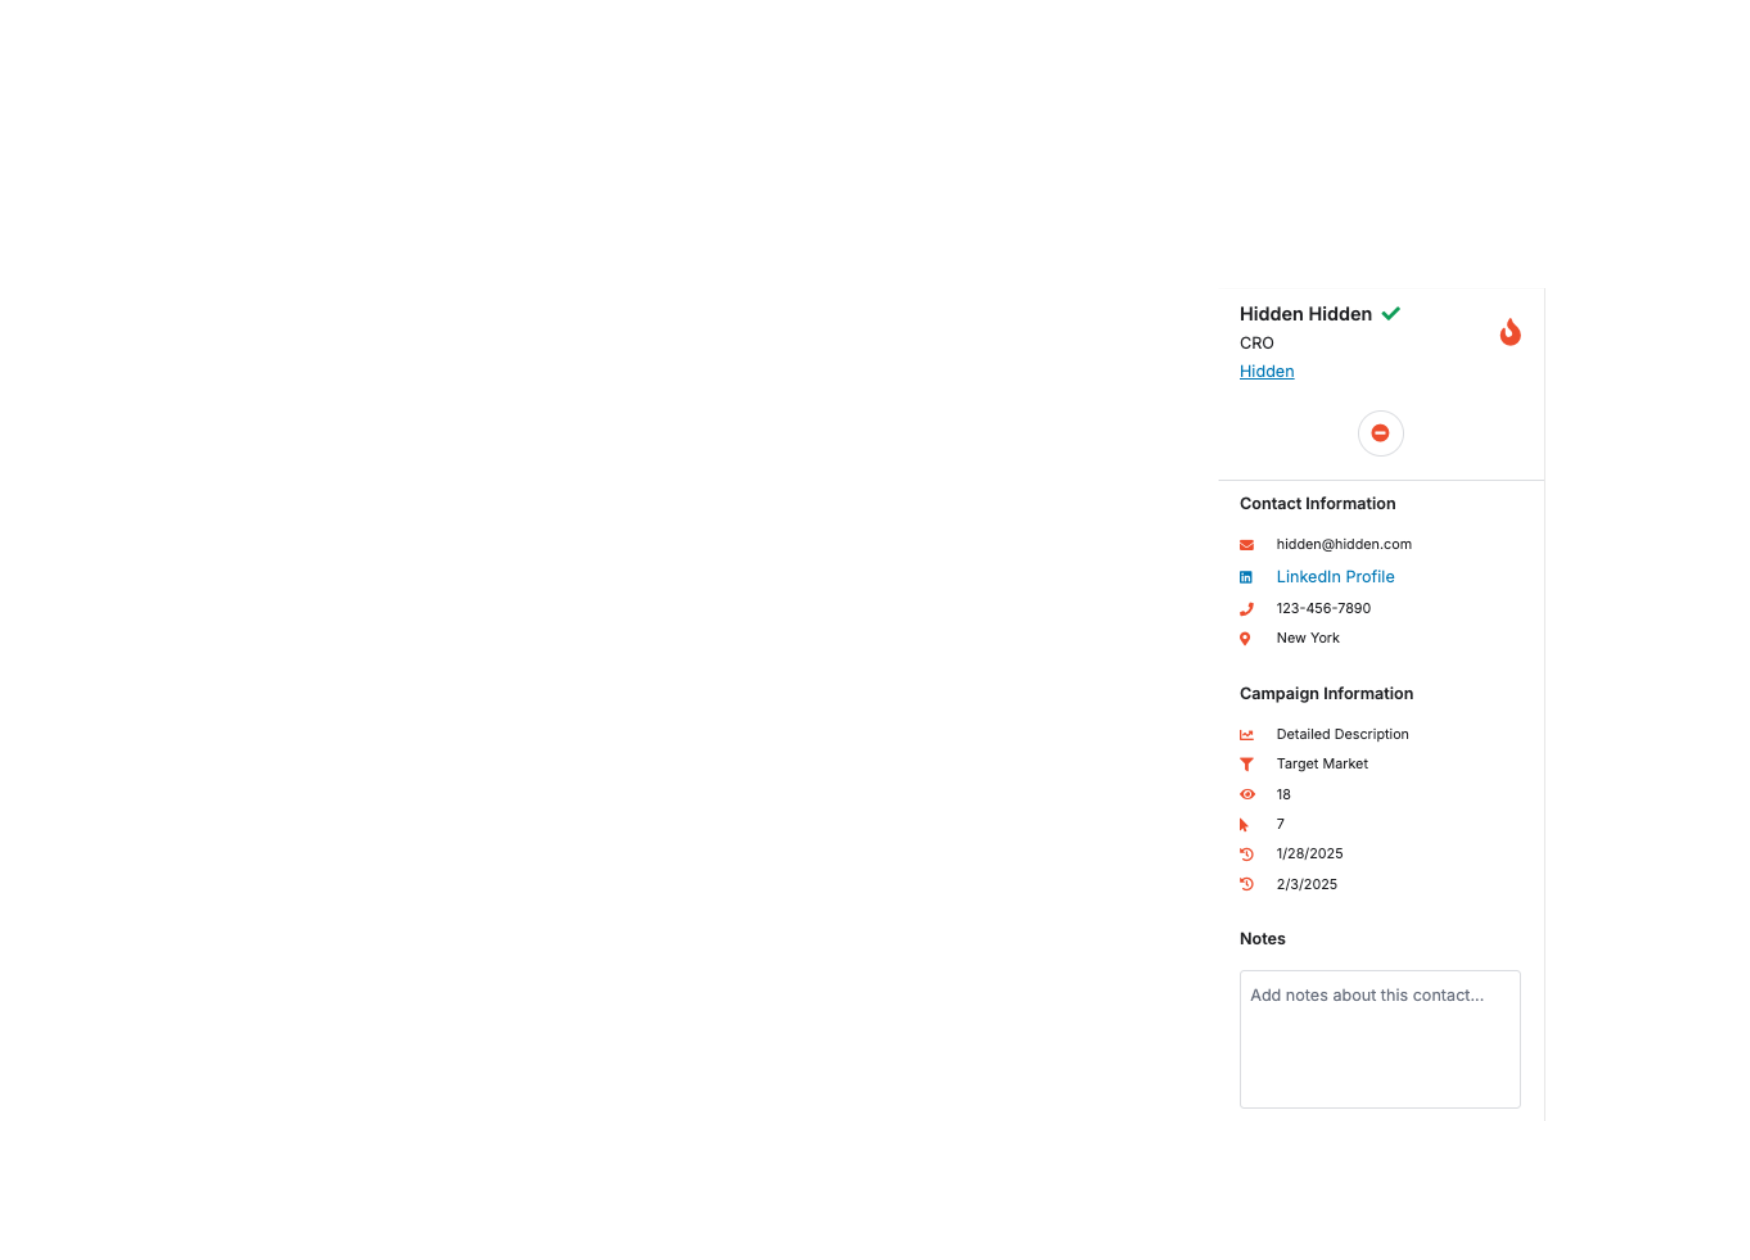
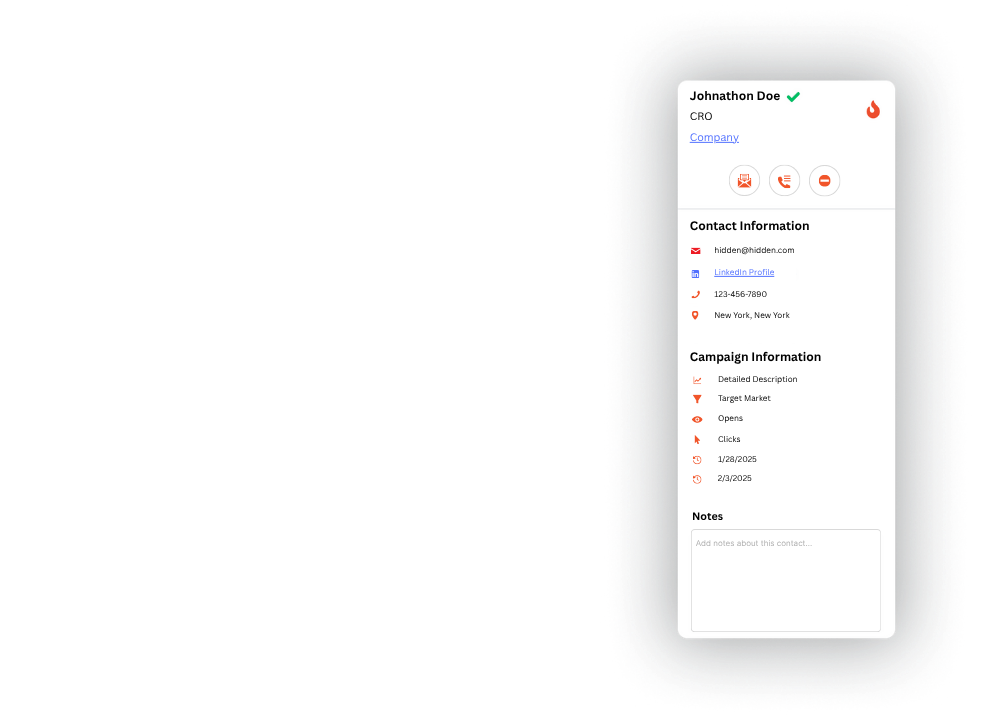
The interface was designed to be clear without being overly simple. Prospect names, titles, companies, campaign statuses, and LinkedIn profiles surfaced at a glance. Color-coded engagement signals let clients identify warm leads without digging through rows of data. A sidebar gave quick access to advanced prospect details and one-click actions tied directly to the CRM: adding to a call list, routing to a newsletter, removing from outreach.
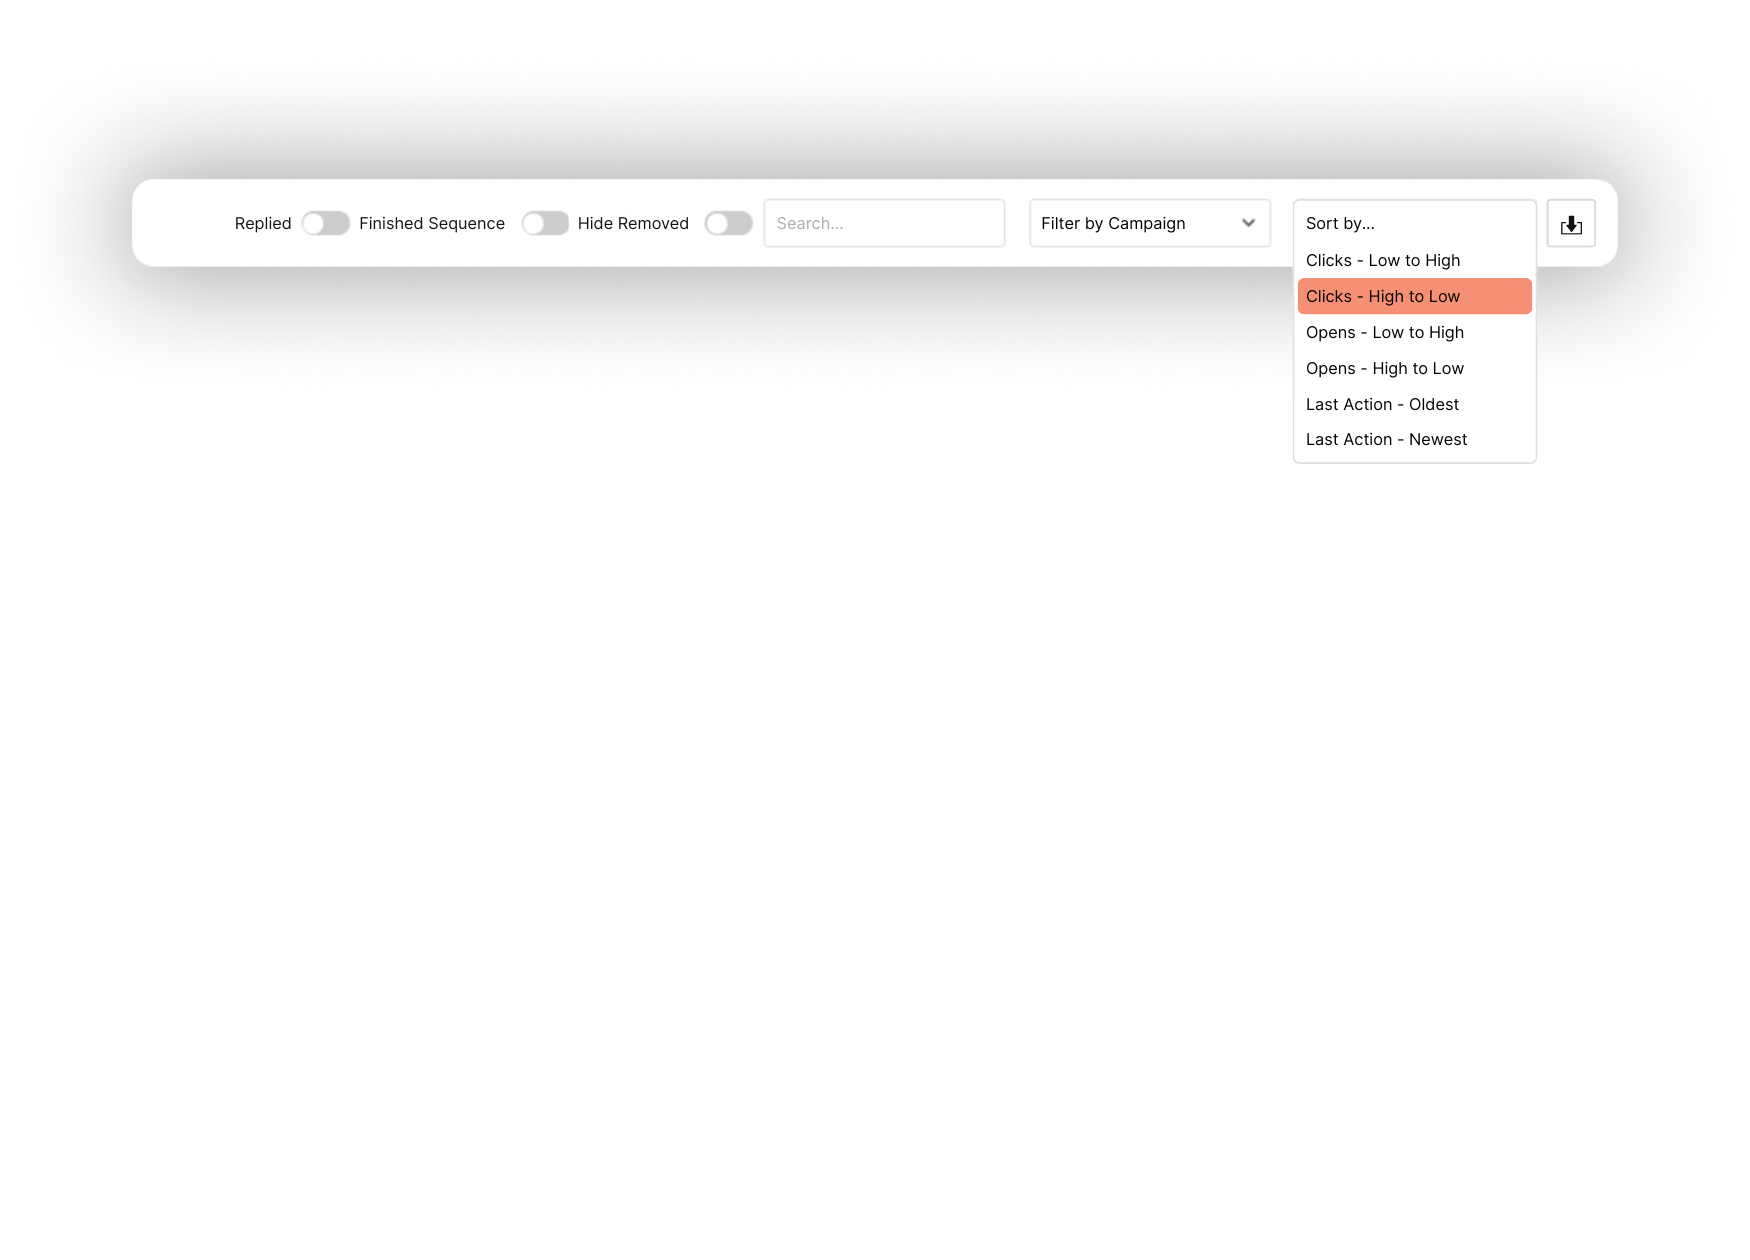
Filters, search, and a download option covered the operational side for clients who wanted to work the data on their own terms. The goal was to put the levers in the right hands and get out of the way.
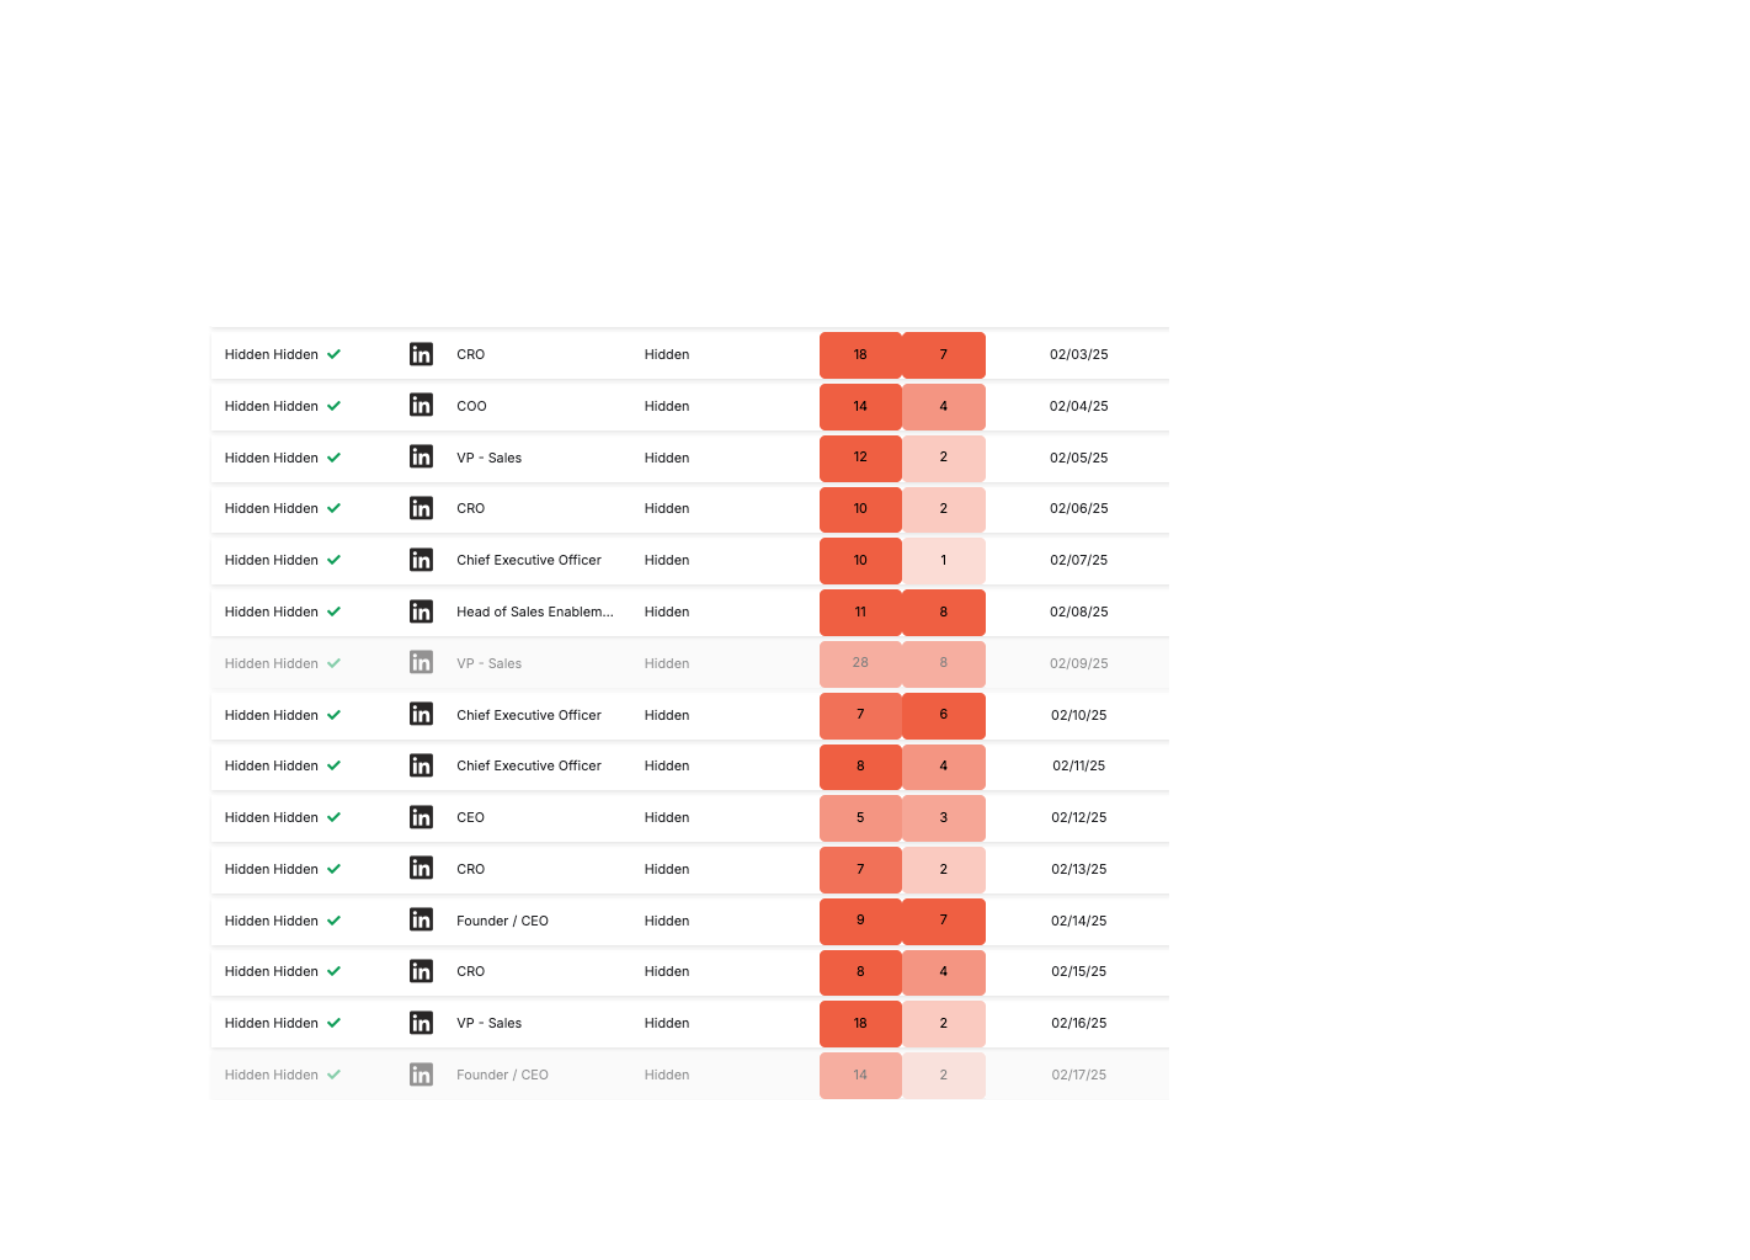

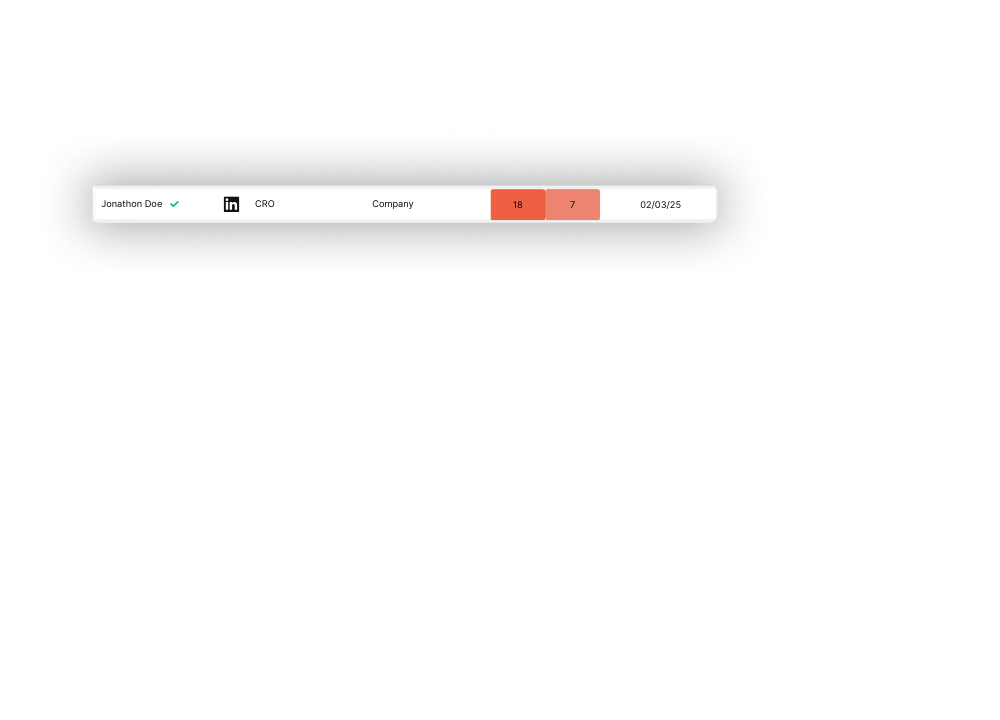

Readiness to engage Color coded open and click metrics so the client knows exactly who to engage with.
Last Action Date No more guessing about when the prospect last interacted with your outreach.
Search and Filters Search for prospects based on a number of variables, from a name or company to more detailed information like location.
Download Spreadsheets are still useful. Users can download the list to work with the data however they choose.
Prospect actions Custom quick actions that communicate with the client CRM. Send to newsletter or call list, or remove from outreach.
Advanced information Key details at a glance without scrolling rows of cells.
What This Project Shows
The skill that made this project work was seeing a real problem, finding the right tool for it, and moving before anyone asked. Strategic clarity paired with execution is what JAMworks brings to every project. The dashboard also illustrated something most agencies do not think to pursue: the difference between delivering a service and operating as a platform. When clients have live data, direct controls, and no dependency on the team to take action, the agency stops being the bottleneck and starts being the infrastructure they work inside. That shift changes how clients perceive the relationship and what they are willing to pay for it. Whether the work is a redesign, a campaign, or a custom tool, the process looks the same: understand what is actually needed, make the case for it, and build it.
If your agency is running on workarounds, we can help you find a better answer. Browse our work or get in touch.
FAQ
How do AI-powered marketing dashboards work?
They use AI-assisted development tools to generate functional front-end code from plain language descriptions. The result is a live, interactive interface that pulls real data from your existing systems without requiring a dedicated engineering team to build or maintain it. Salesforce's research on how marketers access and act on real-time data speaks directly to why this capability matters.
Can a small agency afford to build a custom client dashboard?
Yes. The dashboard in this case study was prototyped using a tool that cost $20 a month, with Google Cloud infrastructure overhead low enough that it remained negligible at scale. The barrier has shifted from budget to knowing where to start.
What data should a marketing dashboard show clients?
At minimum: prospect status, outreach activity, engagement signals such as open and click rates, and last action dates. The most useful dashboards also let clients act directly, routing a prospect to a call list or removing them from outreach, without contacting the account team.
How long does it take to build a client reporting dashboard?
A working prototype can be built in days using modern AI tools. A production-ready version with live data, CRM integrations, and a polished interface typically takes a few weeks depending on the complexity of the data sources involved.
What makes a marketing dashboard actually useful?
Interactivity and live data. A static snapshot dressed up as a dashboard creates more questions than it answers. The tools that serve clients well let them filter, search, and act without making a phone call.
Do clients actually use dashboards when agencies build them?
They do when the interface respects their time. That means no learning curve, clear visual hierarchy, and actions they can take in one click. Dashboards that require training or explanation get ignored.
Ready to turn a tool you have been putting off into something that works? See our services, explore our work, or start a conversation.